TL;DR
Current industry average: In 2024, running a Class 8 truck cost ~$2.26 per mile on average across for-hire carriers (down slightly from 2023's $2.27).
Biggest line items: Driver wages/benefits, fuel, truck & trailer payments, maintenance, and insurance. In 2022 (for context), ATRI recorded per-mile figures of ~$0.724 wages, ~$0.641 fuel, ~$0.331 truck & trailer payments, and ~$0.196 maintenance.
Your number will vary by sector (TL, LTL, reefer, flatbed), region, utilization, equipment age, and financing.
What "cost per mile" (CPM) actually includes
Your total CPM usually combines:
Variable costs: Fuel, DEF, tires, tolls, repairs & maintenance.
Fixed / time-based costs (allocated by miles): Truck & trailer lease or depreciation, insurance, permits & licenses, back-office/overhead, and driver pay/benefits.
Industry benchmarking from ATRI (American Transportation Research Institute) is the standard reference; their latest reporting shows the 2024 all-in average at ~$2.26/mile (slightly lower than 2023's $2.27/mile).
Why you still see 2022 numbers in articles: 2022 was a spike year where costs first topped $2.25/mile; those line-item breakouts are still helpful for context and modeling.
Typical per-mile breakdown (benchmark context)
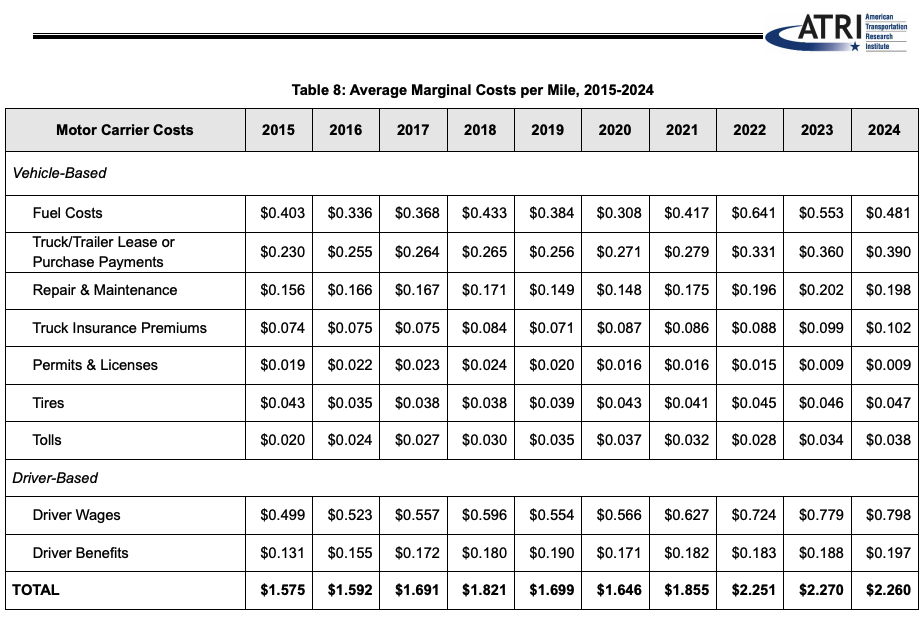
Recent benchmark highlights from ATRI's 2024 Operational Costs study:
- All-in average CPM: $2.27 (2023) → $2.26 (2024)
- Non-fuel costs rose even as diesel eased in 2024; excluding fuel, 2024 marginal costs hit a record $1.779/mile
- Context from 2022 (per-mile): Fuel $0.641, Driver wages $0.724, Truck+trailer $0.331, R&M $0.196; permits/licenses & tolls were smaller shares
Takeaway: Driver compensation and equipment payments are now as pivotal as fuel when managing CPM.
How to calculate your Class 8 CPM (with an example)
Formula:
CPM = (All operating costs for the period) ÷ (Total dispatched miles in the period)
Step-by-step process:
1. Add fixed/time-based costs for the period
- Lease or loan payment, insurance, permits & licenses, ELD/tech, office, etc.
2. Add variable costs for the period
- Fuel + DEF, tires, tolls, parking, wash, repair/maintenance
3. Divide by dispatched miles
- Use paid or all miles consistently (deadhead matters)
Example calculation:
- Monthly fixed/time-based costs: $12,000
- Monthly variable costs: $18,000
- Total dispatched miles: 15,000
CPM = ($12,000 + $18,000) / 15,000 = $30,000 / 15,000 = $2.00/mile
Compare your result to the industry average of ~$2.26/mile (2024) to see where you're high/low.
What moves CPM up or down?
Key factors affecting your cost per mile:
Fuel price & MPG: Fuel is still a top driver; a ±$0.50/gal swing or 1 MPG change can move CPM meaningfully. (In 2023, industry CPM rose to $2.27 even as fuel eased - because non-fuel costs climbed.)
Driver wages & benefits: Competitive pay has structurally risen since the pandemic years; benefits growth continued into 2024.
Equipment costs & interest rates: Higher prices and financing costs keep truck & trailer payments elevated.
Maintenance & tires: Newer equipment may lower R&M; older equipment can cut payments but raise shop time and parts.
Utilization: More loaded miles and fewer empty miles spread fixed costs over more revenue miles, lowering CPM.
Freight mix & geography: Reefer/flatbed often carry higher R&M and insurance; heavy toll regions add CPM quickly.
Owner-operator vs. fleet CPM
Owner-operators can sometimes beat averages via tight cost control and high utilization, but face volatility (cash flow, repairs, insurance underwriting).
Fleets benefit from scale pricing (fuel, tires, insurance) but carry overhead.
Across the industry, 2024 CPM averaged ~$2.26, and operating margins were compressed, especially in TL.
10 proven ways to lower your cost per mile
- Improve MPG (speed discipline, cruise control, aero, idle reduction)
- Spec smart (low-rolling-resistance tires, optimized axle ratios)
- Fuel network discipline (buy on lane strategy, not just price on the sign)
- Preventive maintenance cadence to avoid roadside breakdowns
- Negotiate insurance (telematics, safety coaching, clean CSA)
- Finance strategically (total cost of ownership vs. lowest payment)
- Plan backhauls to trim deadhead miles
- Lane & customer mix (tolls, dwell, appointment reliability)
- Data hygiene (track CPM weekly; spot anomalies early)
- Driver retention (stable staffing reduces recruitment, training, and crash risk costs)
Frequently Asked Questions
Is $2.26/mile profitable?
It depends on your revenue per mile (RPM) and utilization. If your average RPM is below your CPM, you're losing money; many TL carriers faced margin pressure in 2024 even with slight cost relief.
Why do some articles cite $2.25 or $2.27 per mile?
Because the year matters: 2022 averaged $2.251 (record at the time), 2023 $2.27, and 2024 $2.26. Expect updates annually as ATRI publishes fresh data.
What's the single biggest lever?
Fuel and driver compensation are typically the largest line items; in 2022 ATRI recorded ~$0.641/mile fuel and ~$0.724/mile wages for context.
How often should I recalc CPM?
Monthly at minimum; weekly during volatile fuel markets or when changing lanes/equipment.
The bottom line
For planning and pricing in 2025, a practical benchmark for a Class 8 all-in CPM is ~$2.26/mile, with your actuals depending on fuel, wages/benefits, equipment financing, maintenance strategy, and utilization. Track it ruthlessly - and optimize what you can control.
How TACH helps reduce your cost per mile
At TACH, we understand that managing cash flow and reducing operating costs are critical for owner-operators and small fleets. Our financial platform helps truckers:
- See your CPM in the TACH Dashboard to understand your costs and identify opportunities to reduce them
- Track expenses automatically to identify cost-saving opportunities
- Get quick cash advances to handle maintenance before it becomes emergency repairs
- Manage maintenance costs with our network of preferred service providers
Ready to start reducing your operating costs? Get started with TACH today and join truckers nationwide who are taking control of their finances.